- Sat 15 March 2025
- data
- #data, #edinburgh, #analytics, #transport
Why does a 3-mile journey from Leith to Morningside in Edinburgh take almost an hour by bus? I crunched the numbers to find out.
💬 Send me feedback about this article
💻 Get code used for this article
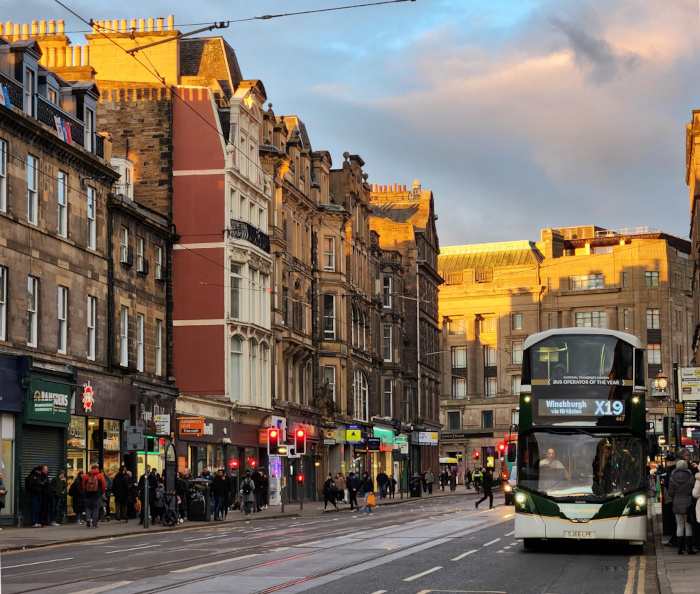
Bus in Edinburgh at Shandwick Place.
Disclaimer added on 2025-04-01: A note on this data exploration & its limitations. As a local bus/cycle user, this personal exploration examines Edinburgh bus journeys solely through the lens of stop distance data. The strong feedback received, for which I am very grateful, highlights the sensitive balance between network efficiency and essential accessibility – a critical consideration, especially for users requiring closely spaced stops, which this analysis does not evaluate. Furthermore, it doesn’t incorporate other major factors influencing real-world travel times, such as traffic congestion (mostly by cars), passenger dwell times (mostly by single-doored buses), or demand-based stopping patterns, meaning broader conclusions require considering these unexamined variables. Therefore, the goal here is simply sharing specific data insights to foster informed dialogue about our vital transport system, not to offer definitive solutions, advocate for stop removals, or overlook the complex needs of all passengers. Should anyone wish to build upon this analysis using the linked data/code, please feel free to reach out – I’m happy to assist where I can.
- The daily Edinburgh bus experience requires patience
- The investigation
- All 105 bus routes & 2,475 bus stops in Edinburgh on a map
- Median distance between bus stops is 273m
- One bus halts at a stop, but sometimes many more
- Driving orientation of buses in Edinburgh aligns with Princes Street
- Conclusions & next steps
The daily Edinburgh bus experience requires patience
If you live in Edinburgh, you know the routine. You hop on the bus, settle in with your coffee, and then - stop. Then start again. Then stop. And again. And again.
That 20-minute journey ends up taking 40 minutes, and you find yourself wondering if walking might have been faster. Sound familiar?
As an Edinburgh resident who relies on Lothian Buses daily, I’ve often wondered: why are our buses so slow despite an extensive network?
Don’t get me wrong, I like the Edinburgh bus system a lot. It’s just that it’s a wee bit slow sometimes. We have one of the best-connected public transport systems in the UK, with routes covering every corner of the city. Yet journeys that should be quick often drag on interminably.
Is it the traffic? The hills? The medieval street layout? Or something else entirely?
The investigation
To answer this, I undertook a data-driven investigation and explored related aspects of Edinburgh’s bus system:
- Collected data on every single bus route and every single bus stop in Edinburgh.
- Mapped all 150 bus routes and their 2,475 stops to visualize bus stop locations and density.
- Calculated distances between consecutive stops on each route to analyze spacing across the network.
- Examined the average number of buses stopping at each bus stop.
- Analyzed the directional orientations of buses throughout the city.
In the following sections, I go into each of these analyses with explanations where necessary.
tl;dr: Buses in Edinburgh are slow because they stop every 323m on average!
All 105 bus routes & 2,475 bus stops in Edinburgh on a map
Edinburgh has a large number of bus routes and an even larger number of stops - 105 routes and 2,475 stops, to be precise.
The following figure shows a representative bus route:
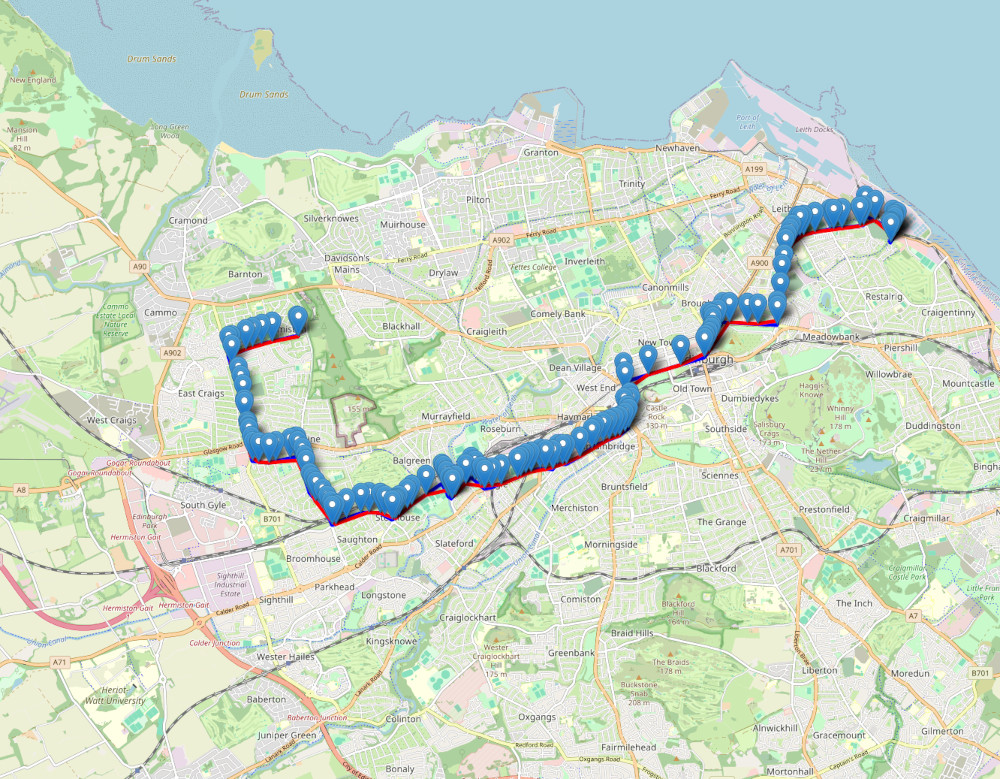
Bus route number 1 (direction Seafield) with 57 bus stops as an example.
Compiling the stops of all bus routes results in a complete list of bus stops. The next figure visualizes both the locations and density of bus stops in Edinburgh.
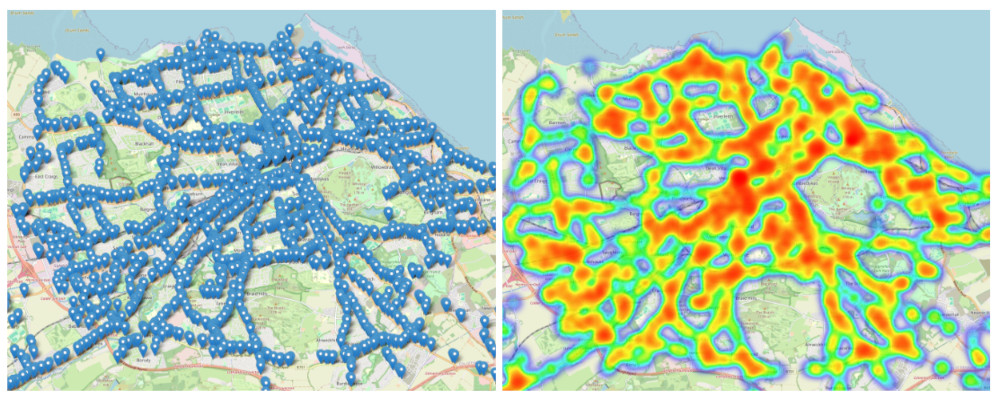
Map of Edinburgh bus stops. (Left) All bus stops plotted as markers. (Right) Density map of bus stops in Edinburgh.
Median distance between bus stops is 273m
I suspected that the issue of slow buses is due to very close bus stops.
To test this, I calculated distances between consecutive stops on each route - not the pairwise distance between all stops, but only between stops that are directly connected by a bus route.
Given that, I computed the distribution of these distances and annotated the results:
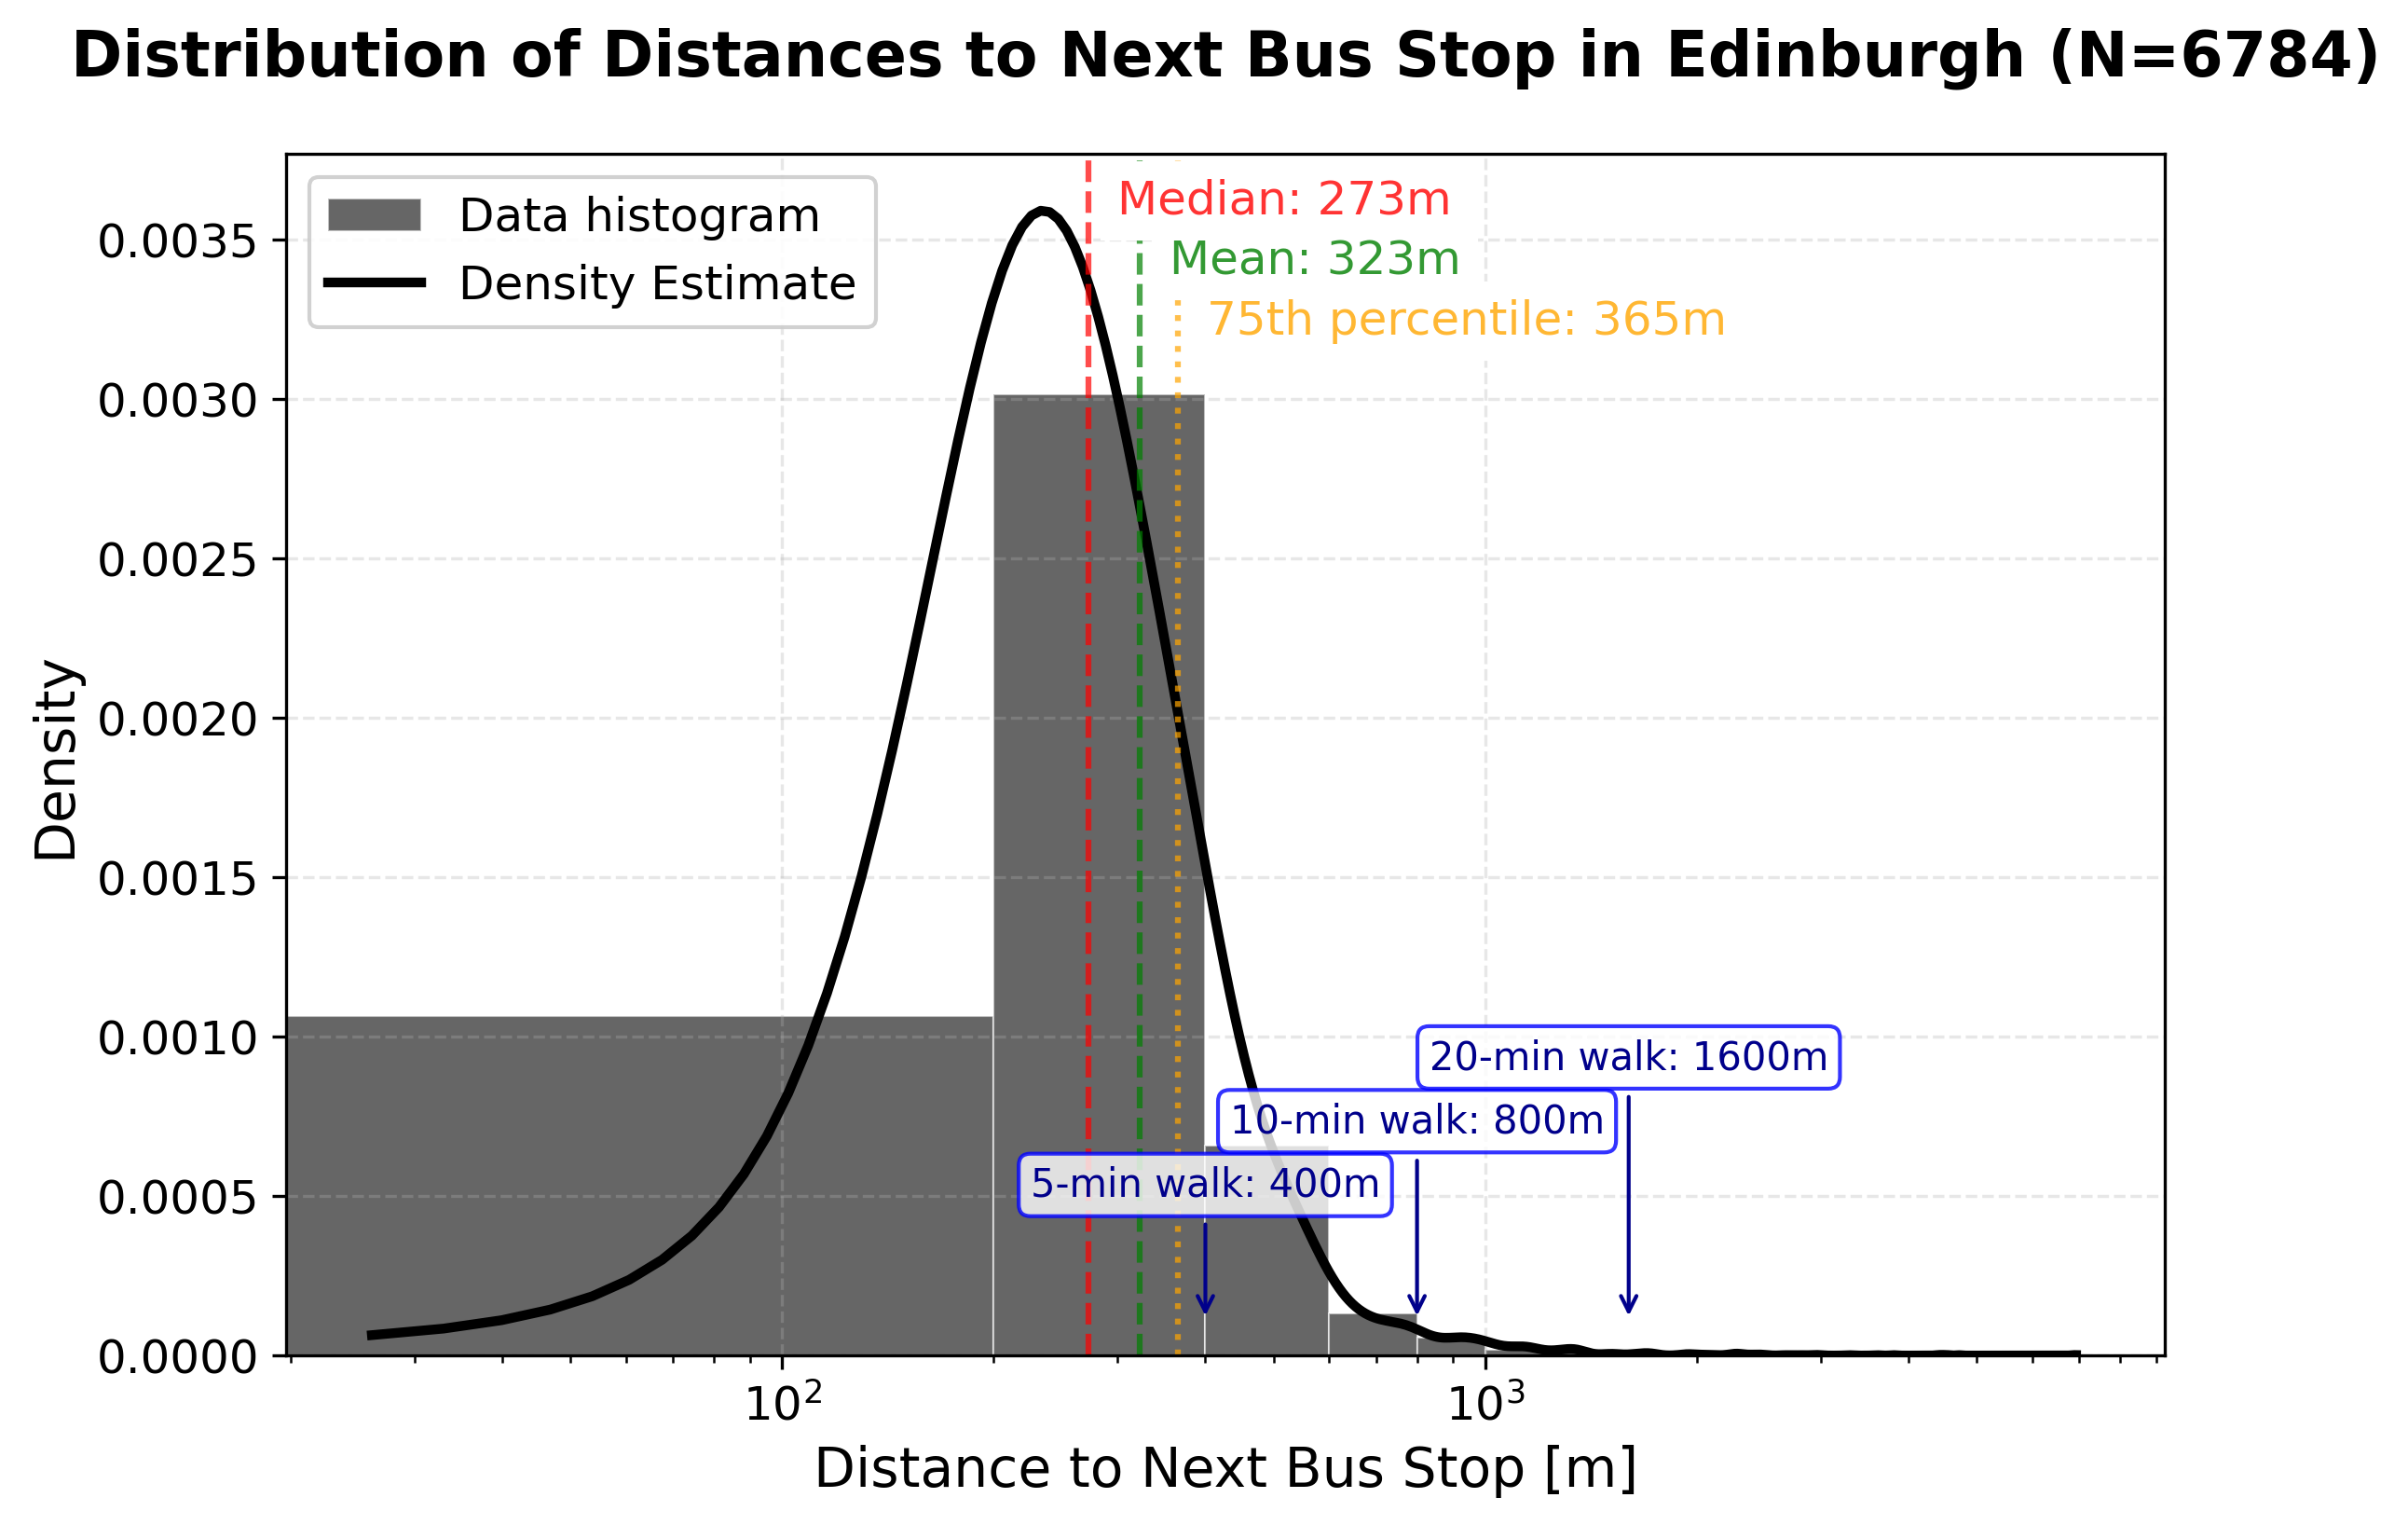
Distribution of distances to the next bus stop in Edinburgh.
This figure is complex, so here’s a breakdown. The solid line represents the continuous density of distances. The bars show the same data binned into understandable ranges: up to 200m, 200m-400m, 400m-600m, etc. The blue boxes highlight distances corresponding to 5, 10, and 20-minute walking distances. Lastly, the colored dashed lines show the median (red), mean (green), and 75th percentile (yellow). These values indicate that 50% of stops are within 273m, the average distance is 323m, and 75% are within 365m. Most stops are closely spaced (<800m), with a long tail of outliers in more rural areas.
This is the main finding: Buses are slow because stops are placed too close together!
A bus traveling at an average of 20 mph stops approximately every 35 seconds due to the mean stop distance of 323m - this is wild!
One bus halts at a stop, but sometimes many more
Next, I examined how many different buses stop at each stop. Below is the resulting distribution:
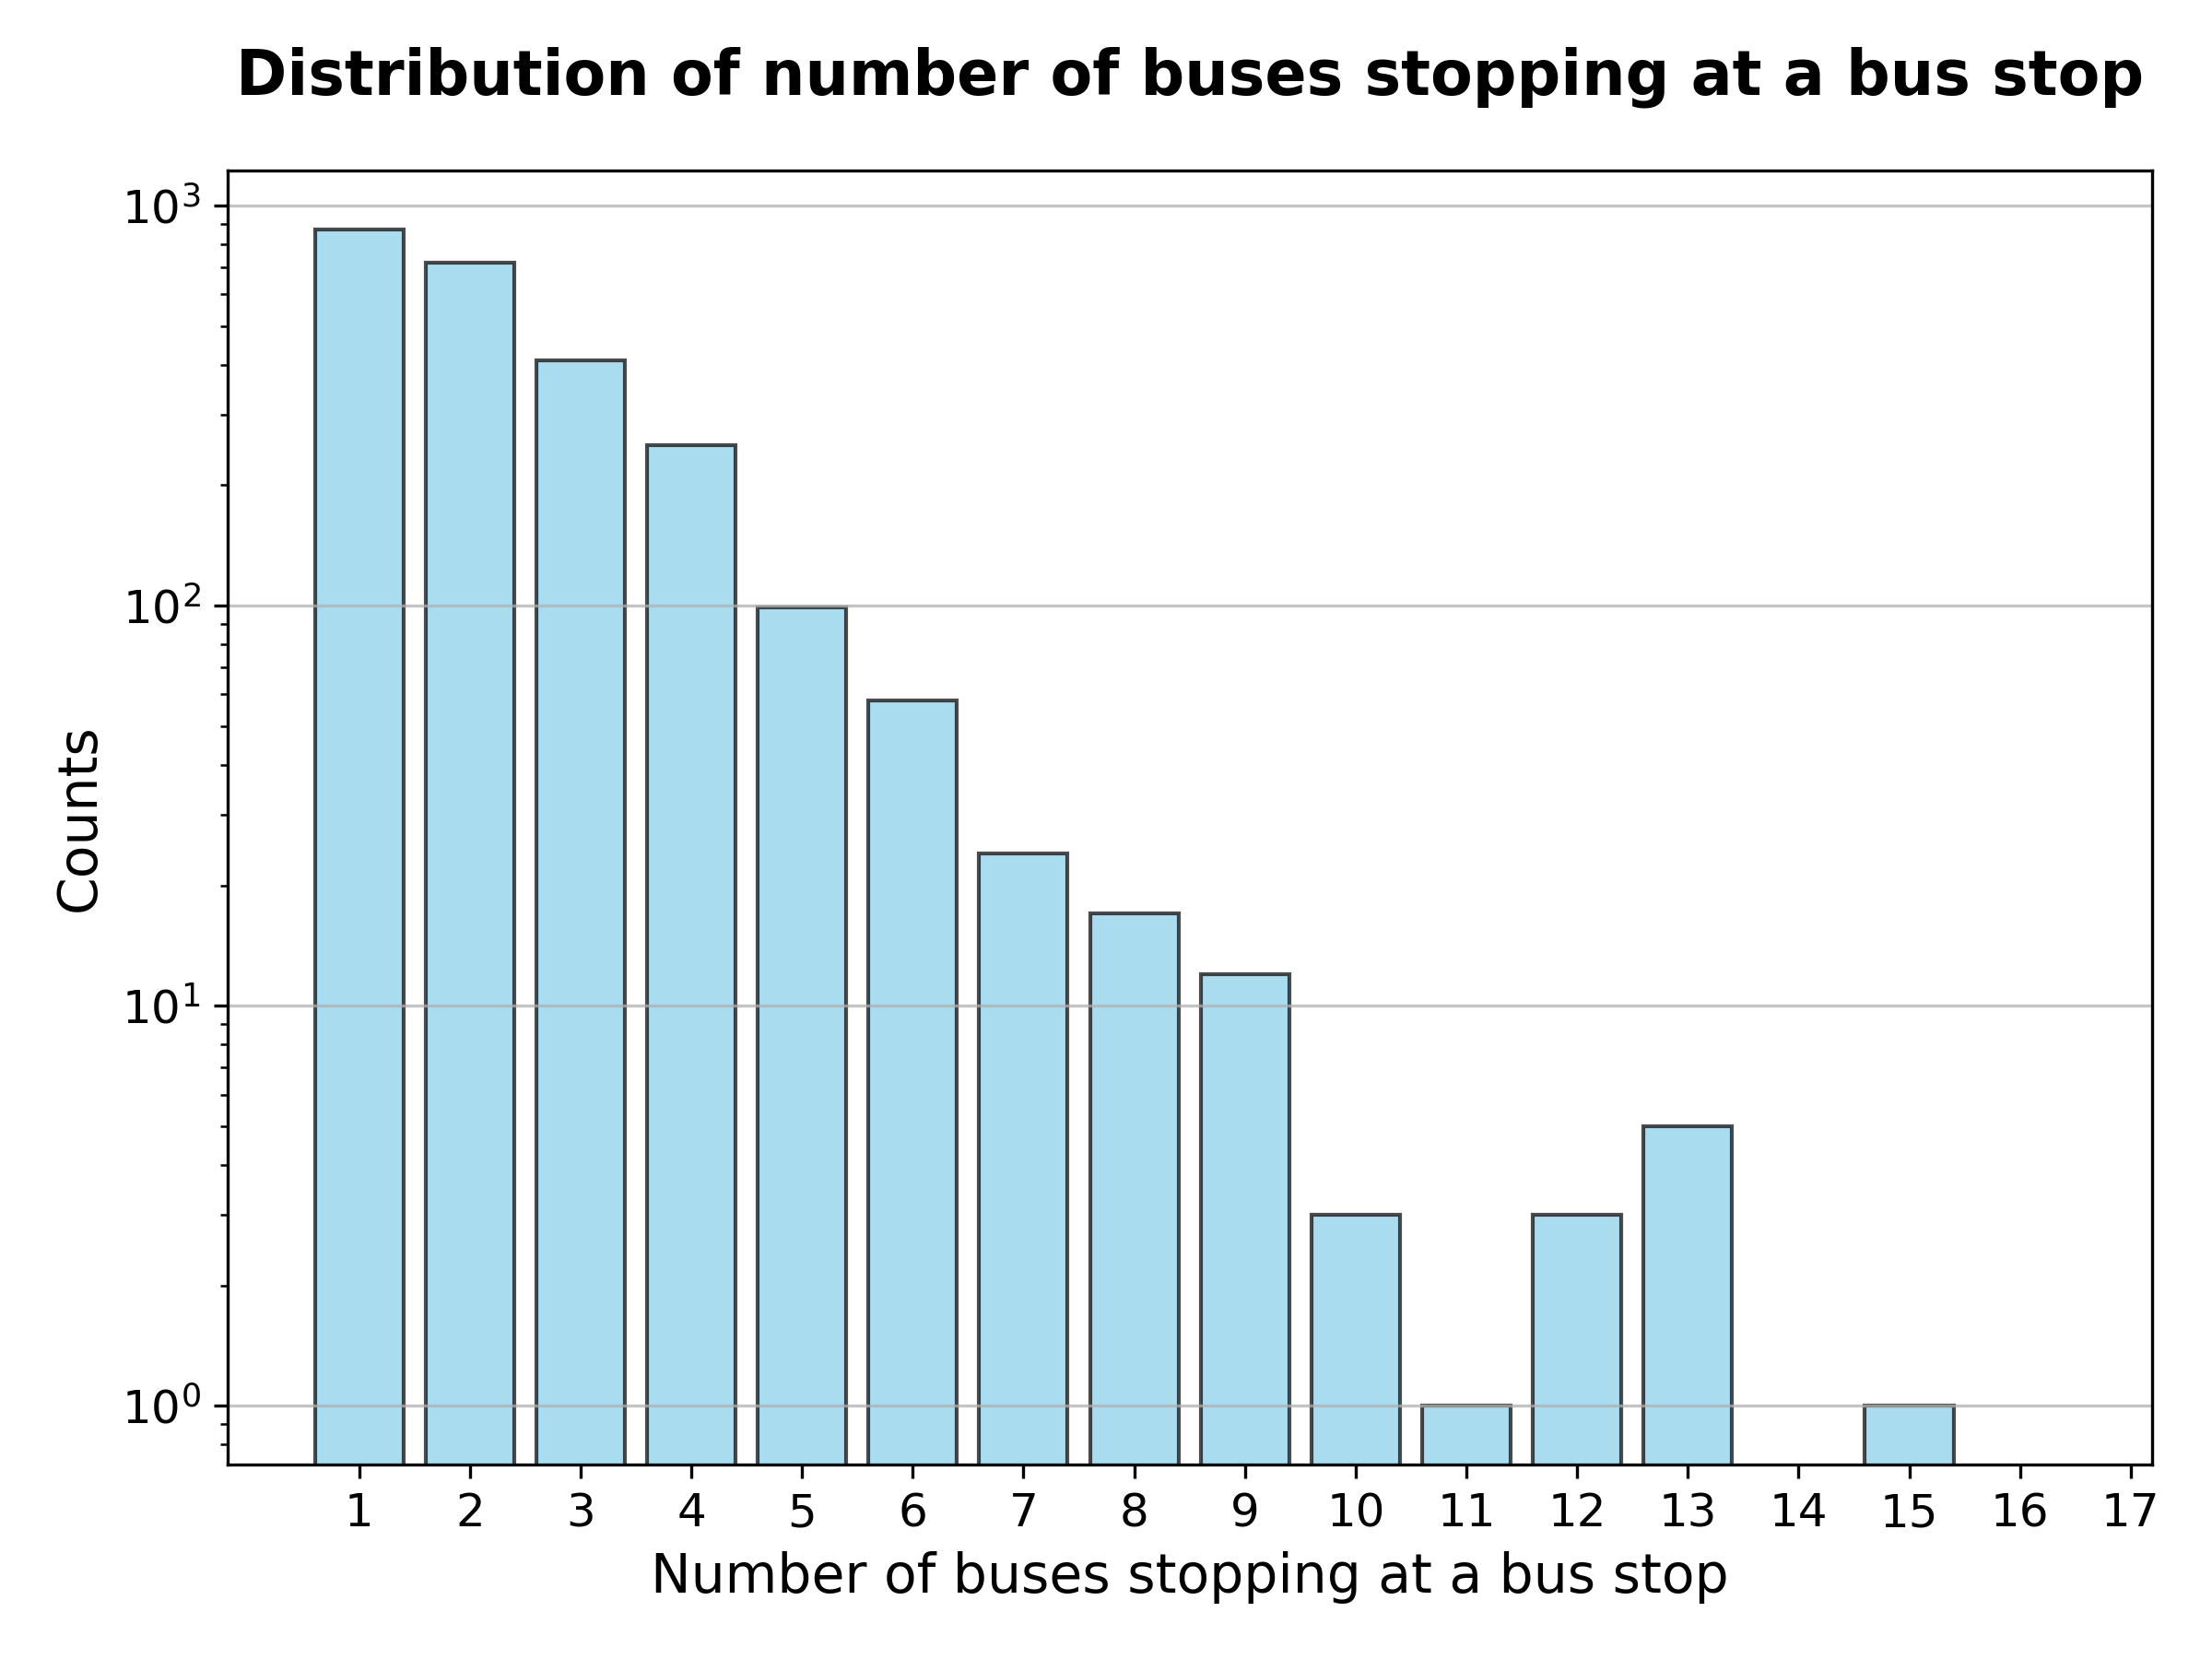
Histogram of the number of buses stopping at each bus stop.
Most stops serve only one route. The distribution follows an approximately exponential decline up to 11 routes per stop. Interestingly, there’s a small peak at 12-13 routes, meaning more stops serve 12 or 13 buses than 11.
Driving orientation of buses in Edinburgh aligns with Princes Street
Lastly, I analyzed the orientation of bus routes to identify Edinburgh’s main traffic axes.
Orientation is measured using a bearing, which describes the direction something travels (e.g., 0° for north, 90° for east). This analysis reveals the predominant travel directions in Edinburgh.
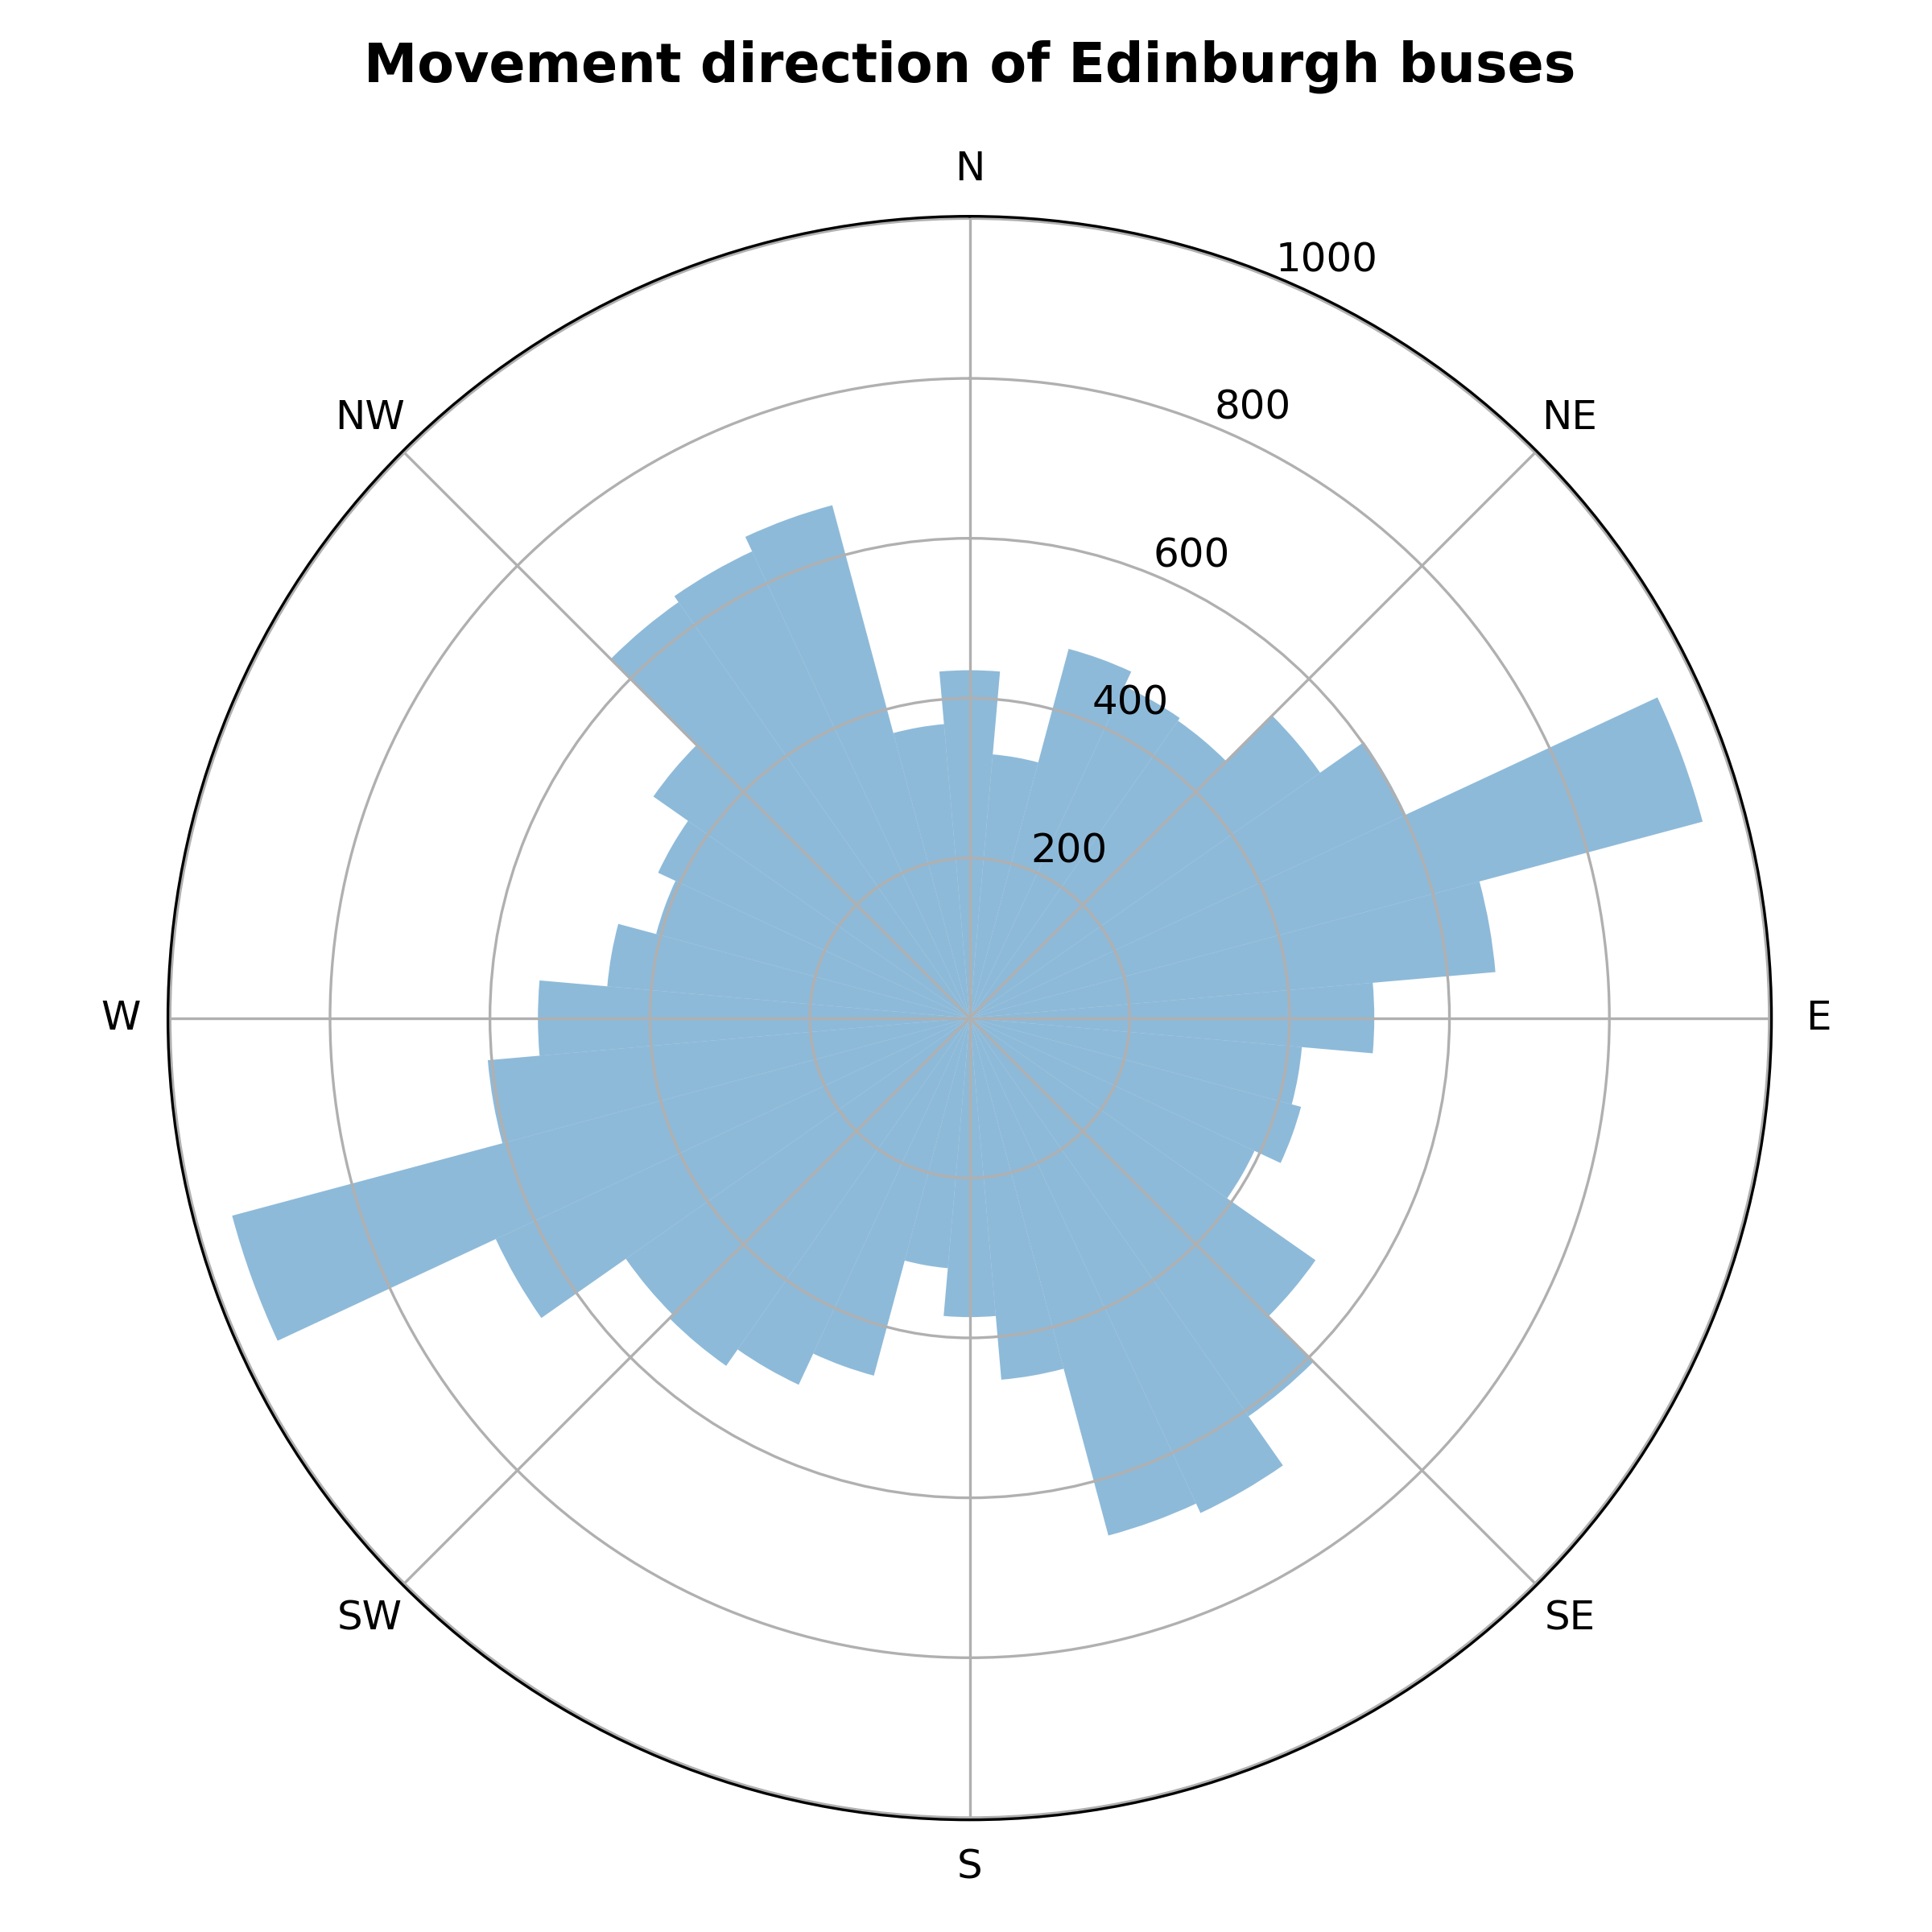
Polar histogram of bus route orientations in Edinburgh.
The most frequent travel direction is roughly SW-NE, followed by NW-SE, forming a cross-like pattern.
Interestingly, the most common direction closely aligns with the Princes Street, one of Edinburgh’s main streets:
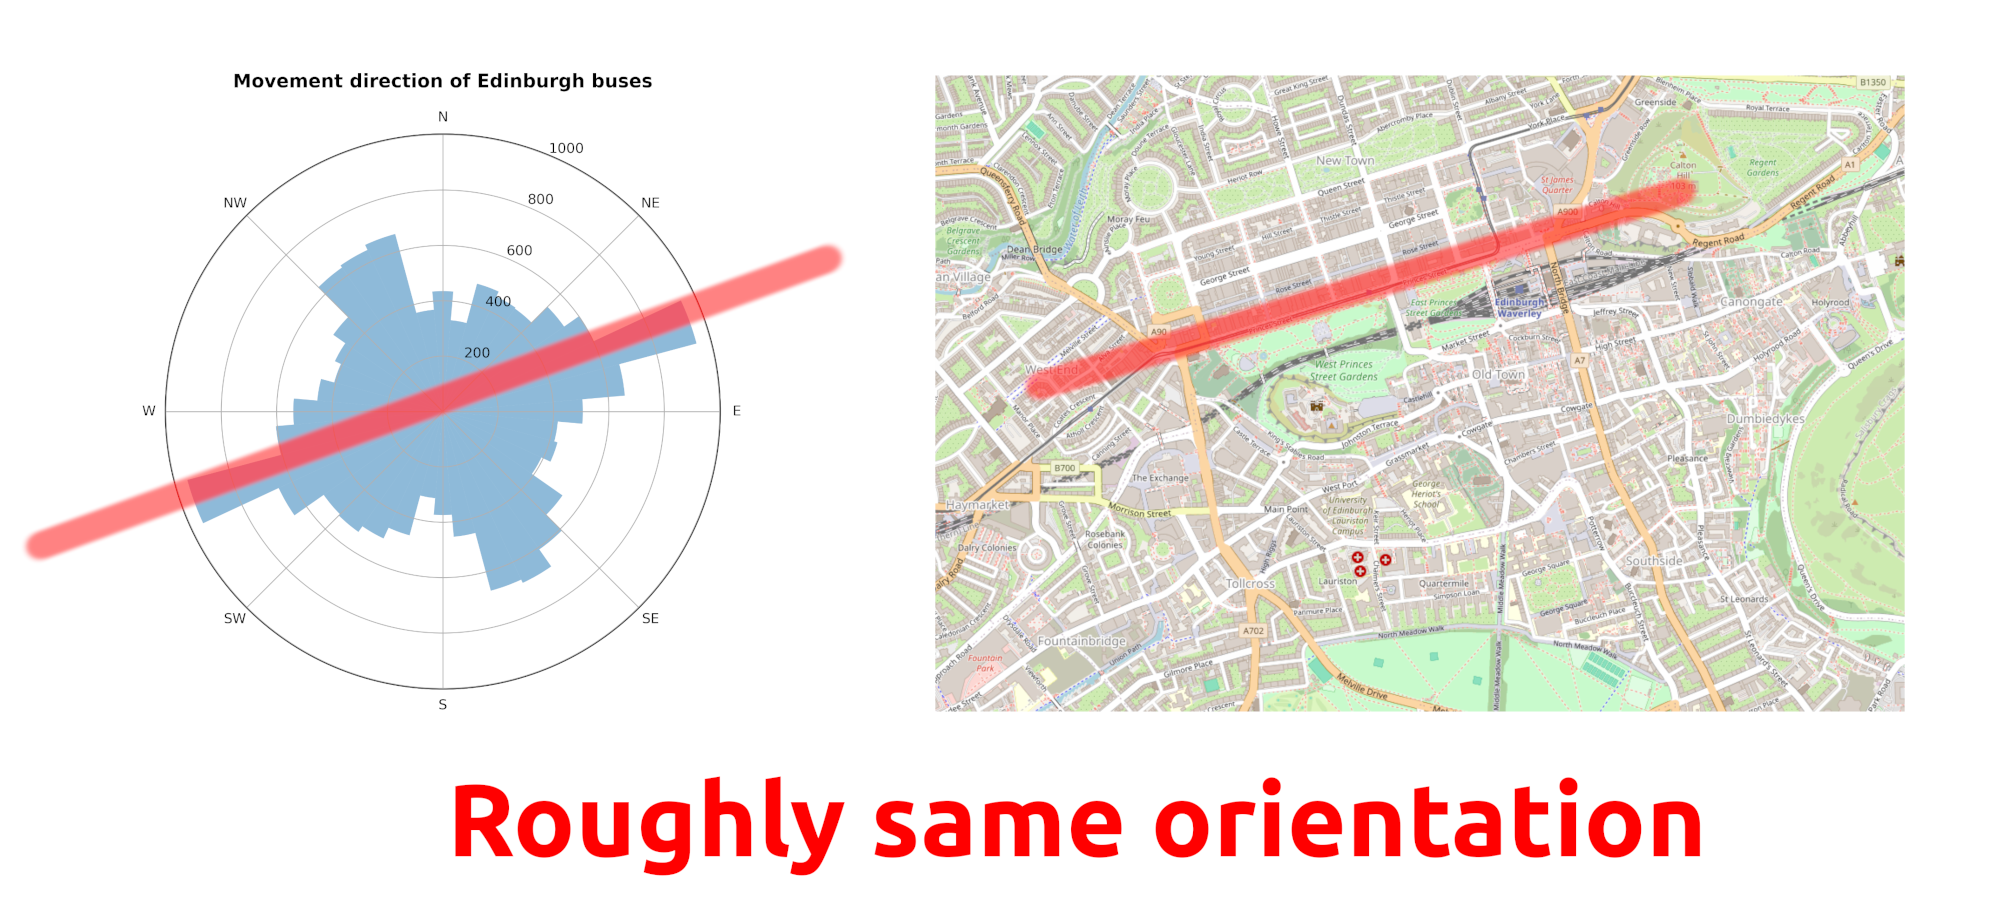
Comparison of most frequent bus travel orientation with Princes Street.
Conclusions & next steps
Buses in Edinburgh are slow because they stop too often. My data shows that 75% of all stop distances are under 365m!
Additionally:
- The number of routes serving each stop follows an exponential distribution, with most stops serving just one route.
- The most common bus travel orientation matches the direction of the Princes Street.
Next steps: The key question now is whether stops are too close - for passengers, traffic flow, wear on vehicles, or fuel efficiency. To study that, further modeling could be considered, for example, by modeling bus velocity as a function of the distance between two stops and determining how removing bus stops would affect door-to-door travel times.
💾 Get the raw dataset here and the processed dataset there!
🫶 I’d love your feedback - email me here.
Methodology note: Data was collected from Transport for Edinburgh on 2024-12-17 using this API. Distances were calculated based on actual routing information instead of straight-line measurements to ensure accuracy.